HumanSignals is an open-source product analytics suite, built for engineers
- Automatically track every event on your website or app
- Understand your users and how to improve your product
- Deploy on your own infrastructure to keep control of your data.
Getting started for free
Follow our User Guide for on-premise deploys.
Features
We bring all the tools into one place to give you everything you need to build better products:
- Event-based Analytics on users or groups - capture your product's usage data to see which users are doing what in your application
- Product data visualizations graphs, funnels, cohorts, paths, retention, and dashboards
- Complete control over your data - host it yourself on any infrastructure
- Session recording to watch videos of your users' behavior, with fine-grained privacy controls
- Automatically capture clicks and pageviews to analyze what your users are doing without pushing events manually
- Feature flags to understand the impact of new features before rolling them out more widely
- Heatmaps to understand how users interact with your product with the HumanSignals Toolbar
- Automated Analysis to find correlations between successful users and their behaviors or attributes
- Plays nicely with data warehouses import events or user data from your warehouse by writing a simple transformation plugin, and export data with pre-built plugins - such as BigQuery, Redshift, Snowflake and S3
- Infinitely extensible use custom plugins to extend HumanSignals and integrate with any service or tool
- And much much more...
Requirements
- You have deployed a Linux Debian/Ubuntu Virtual Machine.
- An instance with 4 vCPU and 8GB of RAM can handle approximately 100k events spread over a month
- We highly recommend an instance with at least 6 vCPU and 12GB of RAM to handle any surges in event volume
- You will also need at least 100 GB of SSD disk
- You have set up a user on Virtual Machine.
- The user must have sudo privileges without a password
- You have set up an A record to connect a custom domain to your instance.
- HumanSignals will automatically create an TLS certificate for your domain using LetsEncrypt
- You have installed on your PC.
- Git
- Ansible
Installation
Download this repository using Git
$ git clone https://github.com/ivolga-tech/humansignals-devops.git
$ cd humansignals-devops/ansible
Create a hosts file with your data
Use this command to create a hosts file with your credentails such as destination IP and user with sudo privileges.
$ VM_IP=<destination IP> VM_USER=<sudo user> envsubst < hosts.example > hosts
Set your domain
- Open the
group_vars/humansignals.yml - Change the
server.hostvalue
Certificate configuration
If you want to use Let's Encrypt certificate:
- Open the
group_vars/humansignals.yml - Change the
productionvalue totrue
Clickhouse configuration
If you want to use external ClickHouse cluster:
- Open the
group_vars/humansignals.yml - Change the
clickhouse.internalvalue tofalse - Set all other
clickhouse.*values
ClickHouse version must be >=21.6.0 and <22.4.0. Humansignals may not work correctly with another version.
Install Ansible dependencies
$ ansible-galaxy install -r requirements.yml
Run Ansible Playbook
$ ansible-playbook -i hosts main.yml
Now you have to wait ~30 minutes.
Check your HumanSignals installation
- Open the web browser
- Enter your domain or use the default
- Congratulations! 🎉🎉🎉
Verify Installation
In this section we check that some of the required steps have been correctly installed and configured.
Check pods
Go to the server where are HumanSignals is deployed and run this command:
$ kubectl -n humansignals get pods
You will see something like this:
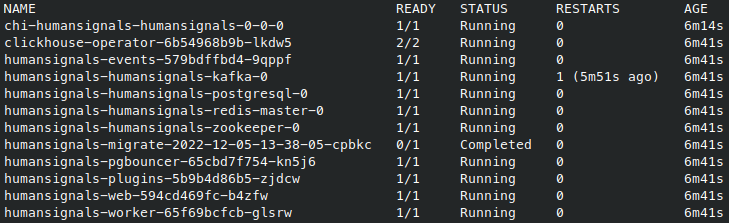
All pods should be running or completed.
Check ingress
Go to your web browser and enter your domain.

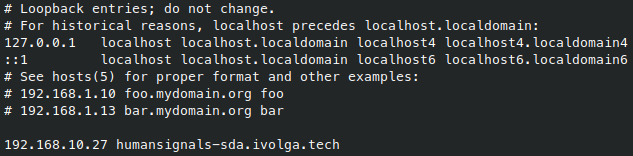
If you do not have real domain, you need to edit your hosts file:
$ echo "<VM_IP> <HS_DOMAIN>" | sudo tee -a /etc/hosts
Troubleshooting
If something went wrong, this section covers a number of steps you can take to debug issues.
Check pods
You can use this command to check that all of our pods are running.
$ kubectl -n humansignals get pods
Check logs
You can use this command to check the logs of our pods.
$ kubectl -n humansignals logs <pod_name> | less
The best way to start your research is with the web container, which runs all database migrations and gives you an error if any of them fail.
Frequently Asked Questions
- Are the errors I'm seeing important?
- How do I see logs for a pod?
- How do I connect to the web server's shell?
- How do I connect to PostgreSQL?
- How do I connect to ClickHouse?
- How do I restart all pods for a service?
Are the errors I'm seeing important?
Here are some examples of log spam that currently exists in our app and is safe to ignore:
The following messages in the ClickHouse pod happen when ClickHouse reshuffles how it consumes from the topics. So, anytime ClickHouse or Kafka restarts we'll get a bit of noise and the following log entries are safe to ignore:
<Error> TCPHandler: Code: 60, e.displayText() = DB::Exception: Table humansignals.sharded_events doesn't exist.
...
<Warning> StorageKafka (kafka_session_recording_events): Can't get assignment. It can be caused by some issue with consumer group (not enough partitions?). Will keep trying.
The following error is produced by some low-priority celery tasks and we haven't seen any actual impact so can safely be ignored.
TooManyConnections: too many connections
  File "humansignals/celery.py",
  ...
  File "clickhouse_pool/pool.py", line 102, in pull
    raise TooManyConnections("too many connections")
How do I see logs for a pod?
- Find the name of the pod you want to get logs on:
$ kubectl -n humansignals get pods
This command will list all running pods. If you want app/plugin server logs,
for example, look for a pod that has a name starting with humansignals-plugins.
This will be something like humansignals-plugins-b7759745d-kwb7b.
- Get the logs for that pod using the name from the previous step:
$ kubectl -n humansignals logs humansignals-plugins-b7759745d-kwb7b
How do I connect to the web server's shell?
HumanSignals is built on Django, which comes with some useful utilities. One of them is a Python shell. You can connect to it like so:
$ kubectl -n humansignals exec -it deploy/humansignals-web -c humansignals-web -- python manage.py shell_plus
In a moment you should see the shell load and finally a message like this appear:
Type "help", "copyright", "credits" or "license" for more information.
(InteractiveConsole)
>>>
That means you can now type Python code and run it with HumanSignals context (such as models) already loaded!
For example, to see the number of users in your instance run:
User.objects.count()
How do I connect to PostgreSQL?
- Find out your PostgreSQL password from the web pod:
$ kubectl -n humansignals exec -it deploy/humansignals-web -c humansignals-web -- sh -c 'echo The PostgreSQL password is: $POSTHOG_DB_PASSWORD'
- Connect to the
humansignalsdatabase:
You're connecting to your production database, proceed with caution!
$ kubectl -n humansignals exec -it sts/humansignals-humansignals-postgresql -- psql -d humansignals -U postgres
PostgreSQL will ask you for the password. Use the value you found out in step 1.
Now you can run SQL queries!
Just remember that an SQL query needs
to be terminated with a semicolon ; to run.
How do I connect to ClickHouse?
- Find out your ClickHouse user and password from the web pod:
$ kubectl -n humansignals exec -it deploy/humansignals-web -c humansignals-web -- sh -c 'echo -e "User: $CLICKHOUSE_USER\nPassword: $CLICKHOUSE_PASSWORD"'
- Connect to the
humansignalsdatabase:
You're connecting to your production database, proceed with caution!
$ kubectl -n humansignals exec -it sts/chi-humansignals-humansignals-0-0 -- clickhouse-client -d humansignals --user <user_from_step_1> --password <password_from_step_1>
How do I restart all pods for a service?
Important: Not all services can be safely restarted this way. It is safe to do this for the app/plugin server. If you have any doubts, ask someone from the HumanSignals team.
- Terminate all running pods for the service:
$ kubectl -n humansignals scale --replicas 0 deploy/humansignals-plugins
- Start new pods for the service:
$ kubectl -n humansignals scale --replicas 1 deploy/humansignals-plugins